Posts

Un supervised learning -Clustering

Image
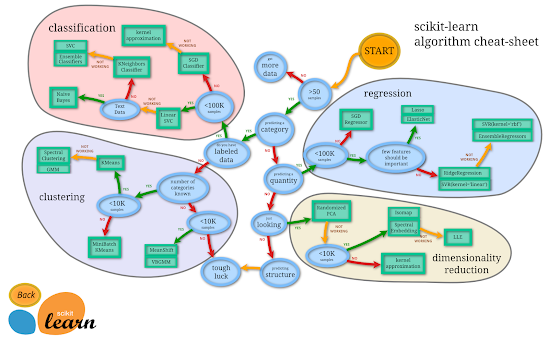
Unsupervised learning: Unsupervised machine learning refers to the category of machine learning techniques where models are trained on datasets without labels. Unsupervised learning generally use to discover the patterns in data and reduce high-dimensional data to fewer dimensions.  Here, I did work on some of the clustering algorithm using scikit-learn namely,  KMeans, DBScan, Hierrarchial clustering. Dimentionality reduction and manifold learning Learning the Algorithm: I Personally feel that data cleaning and Preprocessing are challanging than training the model. Once you finished those 80% of your work is done. Then you can play around with different type of machine learning algorithm. Each algorithms are effective on its own ways. I learned the clustering algorithms through the "iris" dataset in seaborn.  Lets see some of my learning phase of unsupervised learning through Visualization: KMeans: DBScan:  Hierrarchial clustering: Dimentionality reduction: Man...

Time - Series

Image
Fb-prophet We can predict the time analysis using fb prophet.Prophet follows the sklearn model API. We create an instance of the Prophet class and the call its fit and predict methods. Even we can mention holidays in the analysis. In this method monthly-milk data is used.  Source code

ML- Decision tree and Random forest

Image
Introduction: Decision tree in general represent the hierarchical series of binary decision. The decision tree in the machine learning works in exactly the same way and except that we let the computer figure out the optimal structure and hierarchy of decision, instead coming up the criteria manually. In this model, I took the Australian weather dataset for forecasting.  Data Preprocessing: We'll perform the following steps to prepare the dataset for training: Create a train/test/validation split. Identify input and target columns. Identify numeric and categorical columns. Impute missing values. Scale the numeric value. Encode categorical columns to one-hot vector. Data Visualization: Tree is split on the basis of gini index.   Plot is based on the important feature of Weather prediction. Hyperparamter tuning: What we observe is that training model is 99% accuracy and validation set is just above the average, which means machine is memorizing the data in order to increase the a...

Machine Learning- Logistic Regression

Image
Introduction: Last time what we saw is Linear regression which is helpfull in predicting the data which is in certain patern but Logistic regression helpfull in classification problem. For example, whether the person having diseases or not ,whether will rain tommorow or not. Exploraory data analysis: In this phase we usually check the rows and columns of the given data sets and describe it and check wheather the data containing missing value or not. Seperate the numerical columns and categorical columns and split the data into train,val,test test to generalize the model prediction.  Data Visualization : Here we are analysing the co-relation of data. which is helpfull in building the better model. Actually I build a logistic regression model on breast cancer detection and weather prediction which is good for the people who are beginning the carrier in data science. Data Preprocessing : Imputing: Filling the missing value with appropriate technique. Scaling: Scaling is used to reduce...

Machine learning-Linear regression

Image
Hi, guys this is my first machine learning model using linear regression... Introduction: In this model we will predict the insurance amount to be paid by the new customer from a given datasets. Myself download the ACME insurance datasets from the github you can try any other datasets. Let's predict the insurance amount paid by the new customers. Relation between the data: Let's analysis the some of the data using visualization technique. By analyzing the data there is a strong relation between smoker and charges. Scikit learn: It is one of the powerfull machine learning library in the field of data science. In this problem we use this to calculate linear regression(y=mx+c) model, and also using OneHotEncoder to convert multiple object into calculatable values. By understanding the line is just above the cluster this is due to the outliers. This is the simple regression line once we find for single varriable we can easily do it for multiple variable using scikit-learn. Loss: On...

Impact of Covid-19 on India

Image
Hi guys, this is my first blog toward data science!!!!! Introduction: Covid-19 or Coronovirus is a zoonotic disease which means its spread among animals and humans.India is the second most populous country, let's see how its spread and affect the people and their awarness about vaccination.  Impact of Covid-19: Unprepared lockdown which almost destroys the un organised sector. Lots of people lost their livelihood due to unemployment. Central government imposition of National lockdown affect the migration labour most of them crossed thousands of kilometers just by walking. Children's education is miserably affected. Mostly private school student are afford to online resources it create ineqauality in education and it affect basic structure of Indian constitution(Art-21A) Primary and Manufacturing sector are mostly affected which leads to reduction of GDP Total number of Positive cases: Total number of death cases: Inference from the Positive cases and death cases: Despite Mahara...